Full-Stack Fintech Engineering & Quant Consulting

Custom Trading Dashboards & Backtesting Tools for Fintech Teams

I build trading dashboards, backtesting engines, and portfolio trackers for prop firms, fintech startups, and independent traders — end to end, from database to deployment. No account managers, no dev team hand-offs. You talk directly to the engineer writing the code.

Fixed Scope & Quote
Direct Engineer Access
Global Async Delivery
xwen_engine::v3.4
WS 2.1ms
ES_FUT 1M Aggregator
$4821.50
+1.42%
Vol: 148,920
Bid Volume (USD)Ask Volume (USD)
4,821.25
4,821.00
4,820.75
[13:42:09.112] FILL BUY 10 ES @ 4821.50SUCCESS
[13:42:09.840] IBKR_GATEWAY SYNC (0.8ms)ACK
Production ArchitectureNext.js + Python + ClickHouse
Core Specialization

Engineering for Fintech Founders, Desks & Quantitative Teams

Whether you need a custom personal finance app, high-throughput backtesting infrastructure, bespoke financial templates, or a real-time portfolio management dashboard, I engineer production systems built on modern full-stack web architectures.

Consumer & Wealth Tech

Personal finance application

Clean, secure consumer and wealth applications built for individuals, boutique family offices, and fintech startups. From bank API integrations to automated cash-flow forecasting and net worth telemetry, I build interfaces that make financial data intuitive.

  • Open banking & account balance aggregation
  • Automated cash flow & runway forecasting
  • Encrypted, privacy-first local/cloud persistence
Frameworks & Workbooks

Custom templates

Specialized financial models, trading journals, and compliance workflows tailored to your exact operational requirements. Available as high-performance automated workbooks or modular Next.js starter templates with pre-configured charting.

  • Multi-asset trade journaling & PnL logs
  • Custom formulas & automated data pipelines
  • Ready-to-deploy Next.js & Tailwind foundations
Quantitative Infra

Backtesting service

High-throughput backtesting pipelines capable of simulating algorithmic strategies across years of granular tick data. Includes parameter optimization, realistic slippage and fee modeling, and comprehensive Sharpe/Sortino risk reporting.

  • Event-driven execution simulation
  • Columnar tick processing (PostgreSQL / ClickHouse)
  • Automated drawdown & Monte Carlo stress testing
Multi-Asset Telemetry

Portfolio management tools

Institutional and retail portfolio tracking portals that aggregate positions across multiple exchanges and brokerages. Delivers real-time PnL reconciliation, margin and collateral monitoring, and automated risk exposure analytics without spreadsheet lag.

  • Multi-broker API sync & balance aggregation
  • Real-time VaR, Greeks & margin monitoring
  • Automated daily reconciliation & tax exports
Ready-to-Deploy Products & Models

Self-Hosted Dashboards & Financial Models

Off-the-shelf quantitative systems, self-hosted web applications, and formula-automated financial models available for instant deployment on Whop with lifetime access and complete data ownership.

Prefer direct storefront checkout?You can browse our complete software catalog, licenses, and bundles directly on our Whop storefront.

Visit Whop Storefront
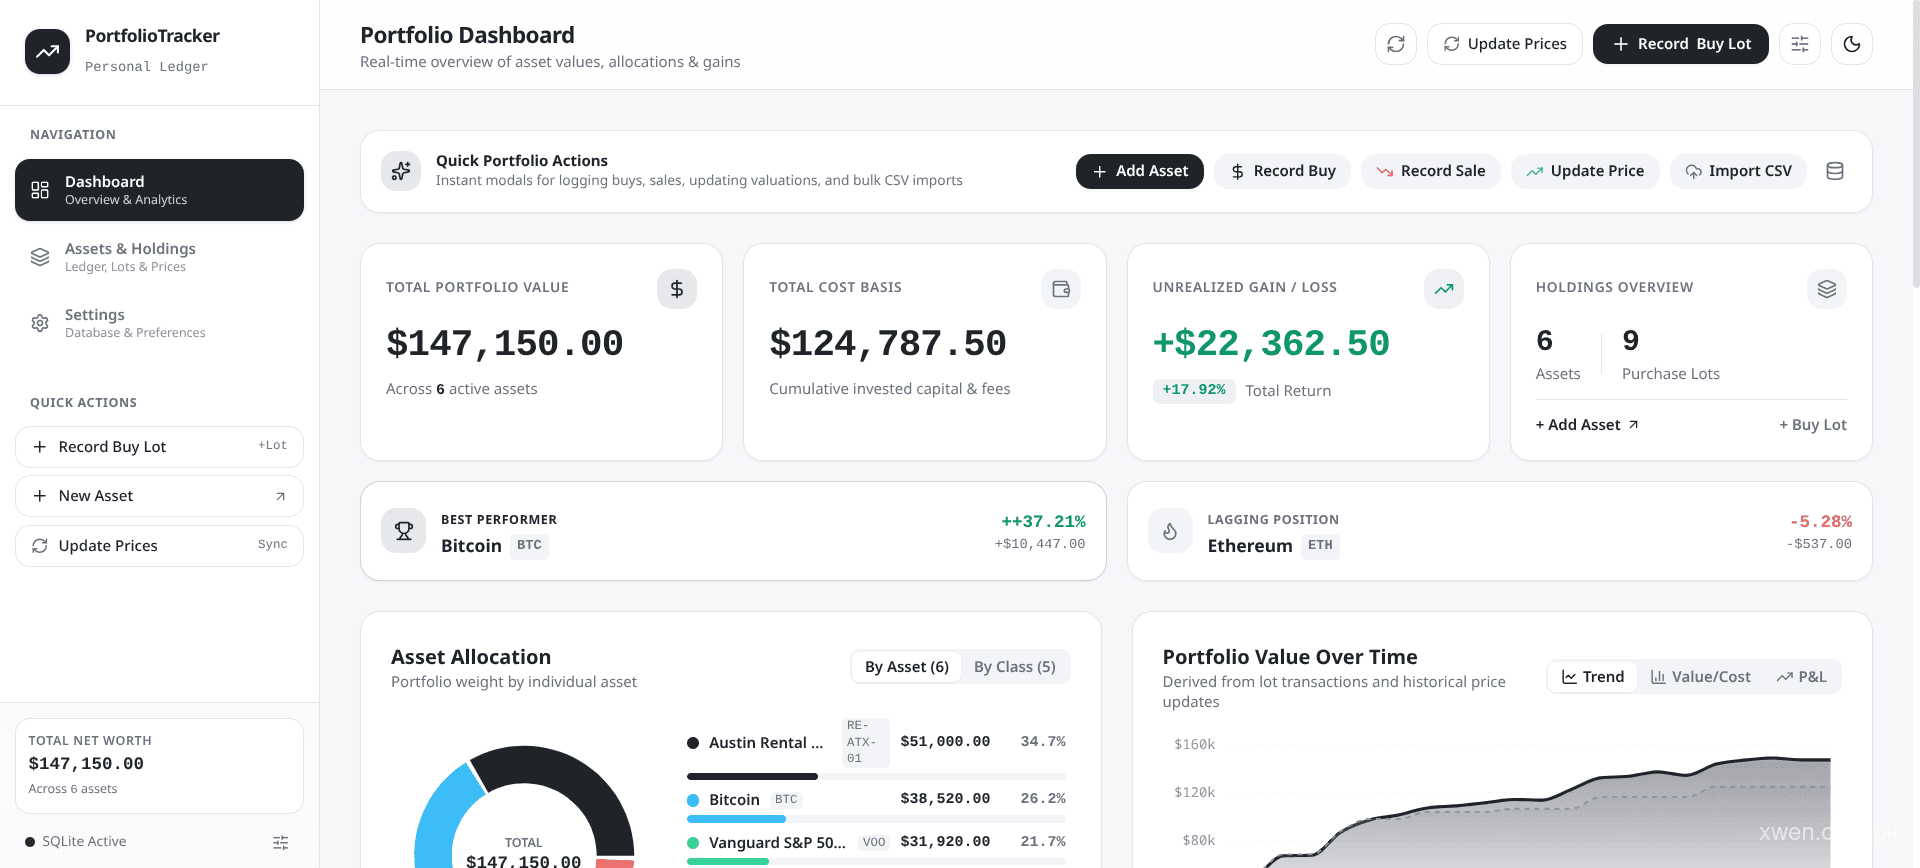
Portfolio Tracker Pro self-hosted investment dashboard overview showing total equity, asset allocation breakdown, and historical return chart
Preview Full High-Res Screenshots
Dashboard Overview: Multi-asset portfolio equity tracking and historical return curves
Self-Hosted Web Application
Next.js • TypeScript • Self-Hosted Database

Portfolio Tracker Pro — Self-Hosted Multi-Asset Investment Dashboard

Institutional-grade, self-hosted web application engineered for tracking multi-asset portfolios across equities, crypto, commodities, and cash. Features real-time PnL telemetry, dynamic asset allocation heatmaps, historical performance benchmarking, and complete data sovereignty with zero recurring SaaS fees.

Real-time multi-asset PnL & historical equity growth curves
Self-hosted deployment (Docker, Vercel, Node) with private database
Dynamic allocation drift monitoring & rebalancing indicators
Zero monthly subscriptions — 100% source code ownership
Next.js 15TypeScriptTailwind CSSSelf-HostedMulti-Asset
Get on Whop
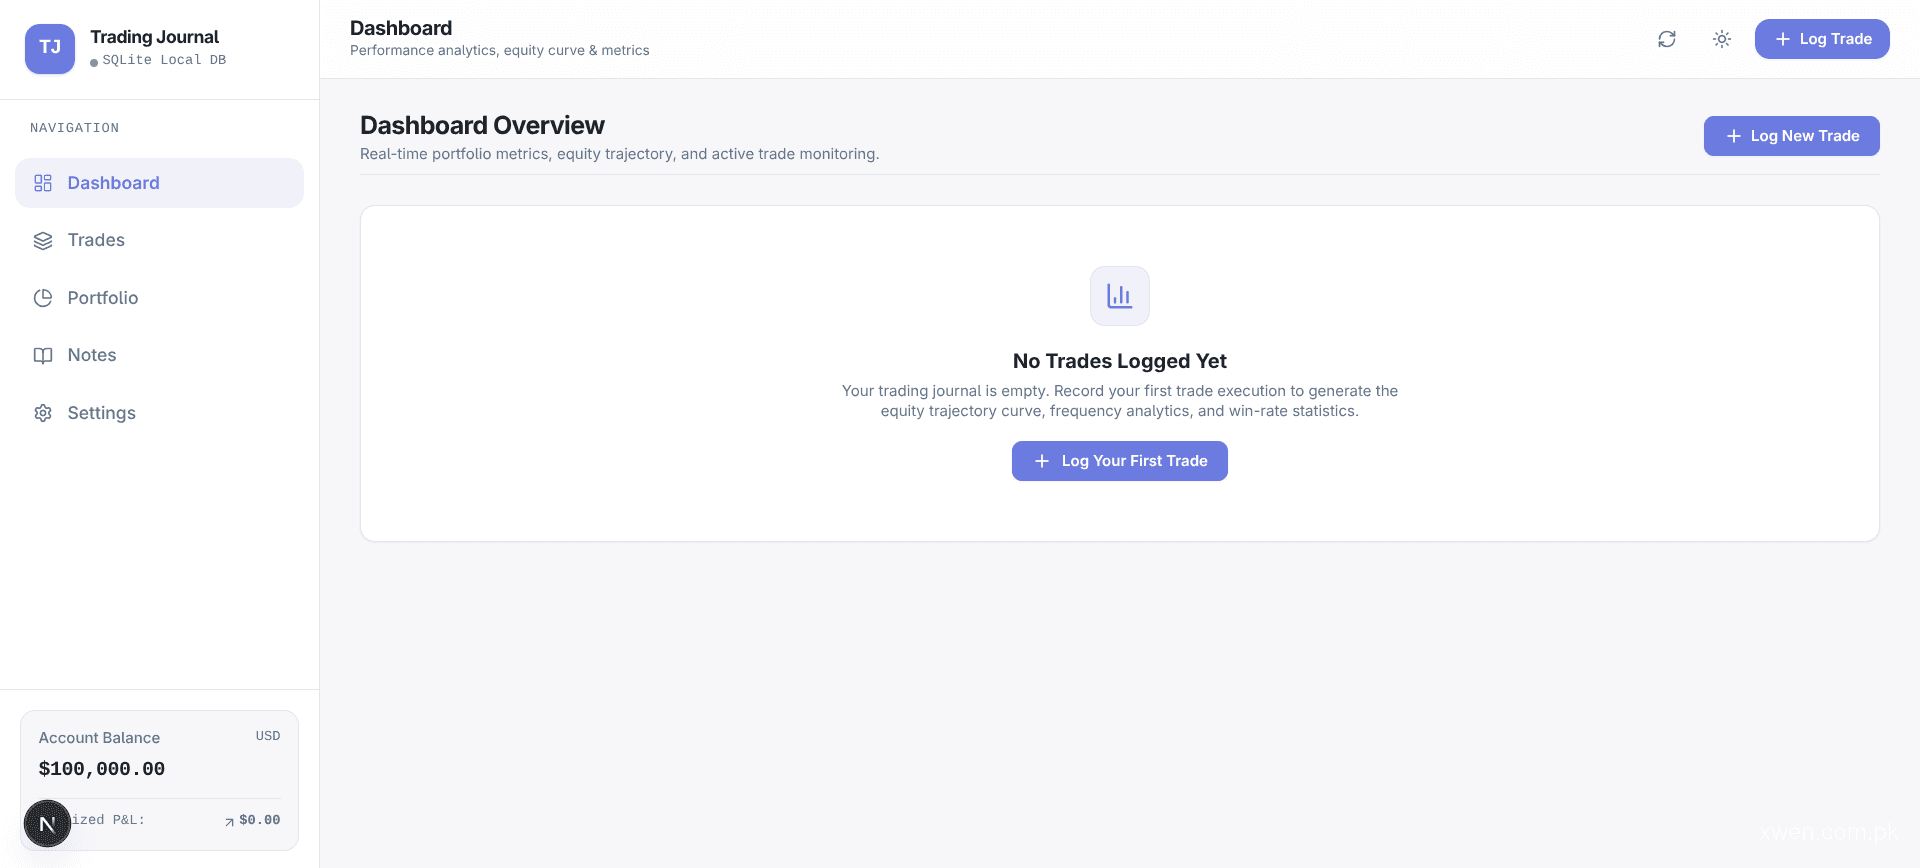
Trade Journal Pro self-hosted trading journal dashboard displaying win rate analytics, cumulative PnL equity curve, and execution logs
Preview Full High-Res Screenshots
Analytics Dashboard: Win rate stats, cumulative PnL equity curve, and expectancy metrics
Self-Hosted Web Application
Full-Stack Dashboard • Private Database

Trade Journal Pro — Self-Hosted Trading Journal with Portfolio Analytics

A production-grade, self-hosted trading journal and execution analytics engine designed for quantitative and discretionary traders. Track trade expectancy, R-multiples, setup attribution, and drawdown metrics with full local database privacy. Eliminate expensive recurring monthly journal subscriptions while owning your complete historical trade telemetry.

Automated win rate, profit factor, and expectancy analytics
Strategy tag attribution, execution calendar & time-of-day heatmaps
Self-hosted database architecture — 100% private trade data
One-click trade import & export with CSV and broker format support
Full-Stack AppSQLite/PostgresTrading AnalyticsSelf-HostedZero SaaS
Get on Whop
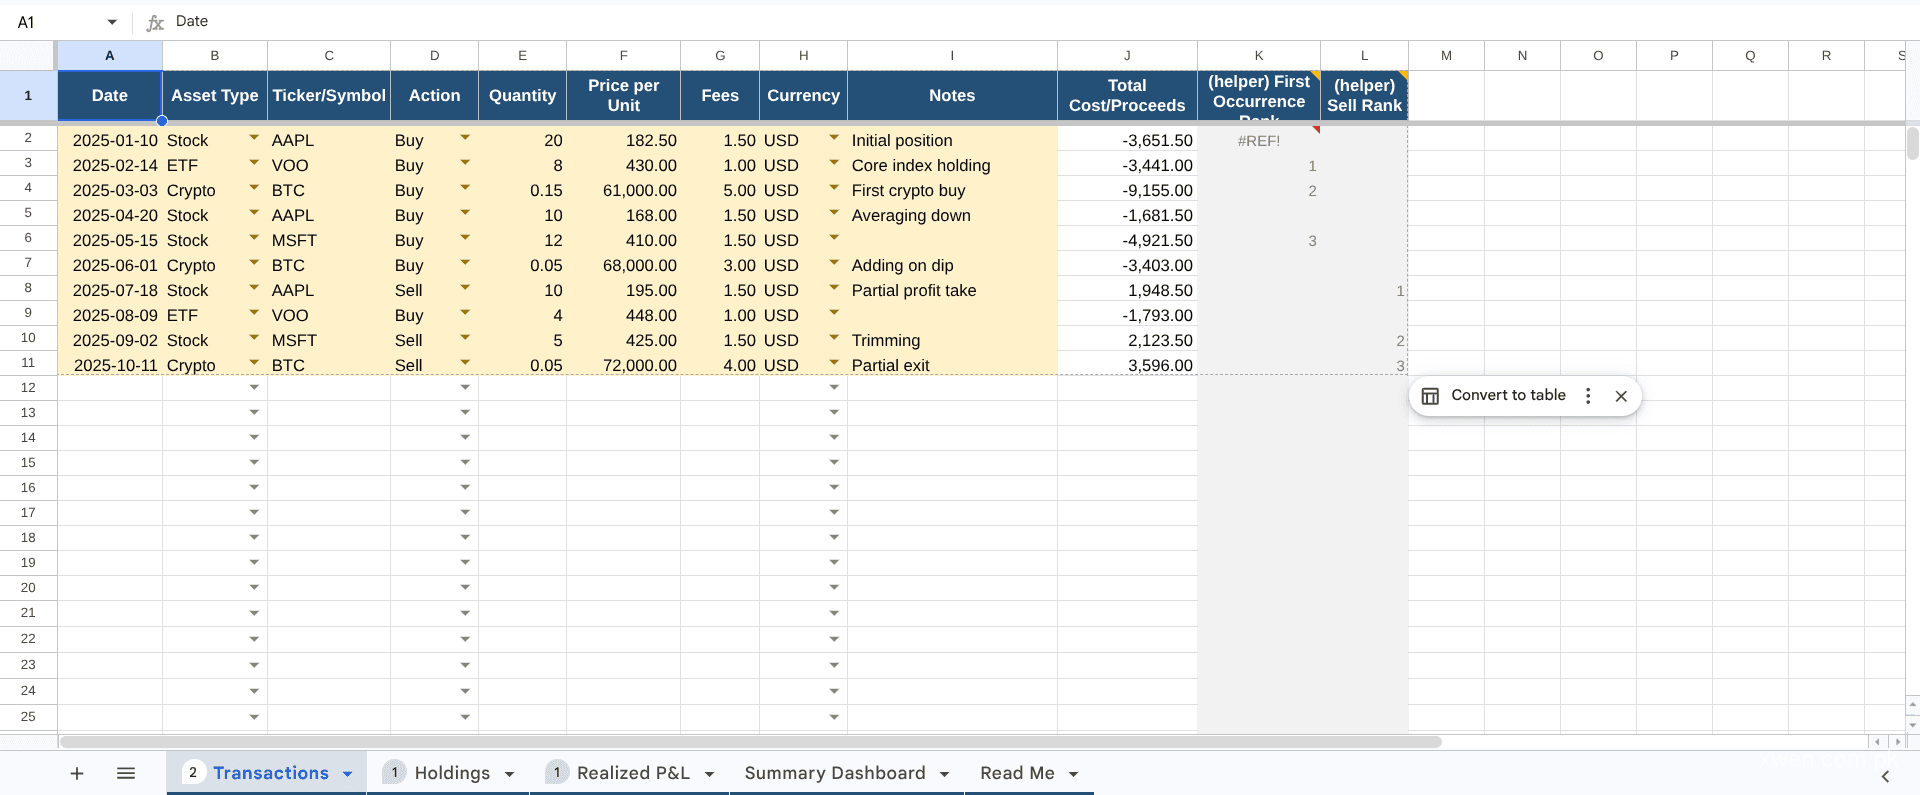
Multi-asset portfolio tracker Google Sheets spreadsheet template with automated price feeds, asset class distribution charts, and dividend tracking
Preview Full High-Res Screenshots
Google Sheets Model: Automated live market prices, allocation charts, and dividend tracking
Google Sheets Financial Model
Google Sheets • Native Formulas • Real-Time Feeds

Portfolio Tracker — Multi-Asset Google Sheets Template

An automated, formula-optimized Google Sheets investment model that tracks equities, ETFs, crypto, and cash positions in real time using native GOOGLEFINANCE and API connectors. Features dynamic rebalancing triggers, currency normalization, dividend yield forecasting, and visual asset allocation charts with zero coding or third-party extensions required.

Automated live market quotes via native GOOGLEFINANCE formulas
Dynamic target asset allocation and portfolio rebalancing alerts
Multi-currency conversion supporting USD, EUR, GBP, and crypto
Clean, institutional financial layout designed for instant copy
Google SheetsGOOGLEFINANCEMulti-CurrencyNo CodeAutomated
Get on Whop
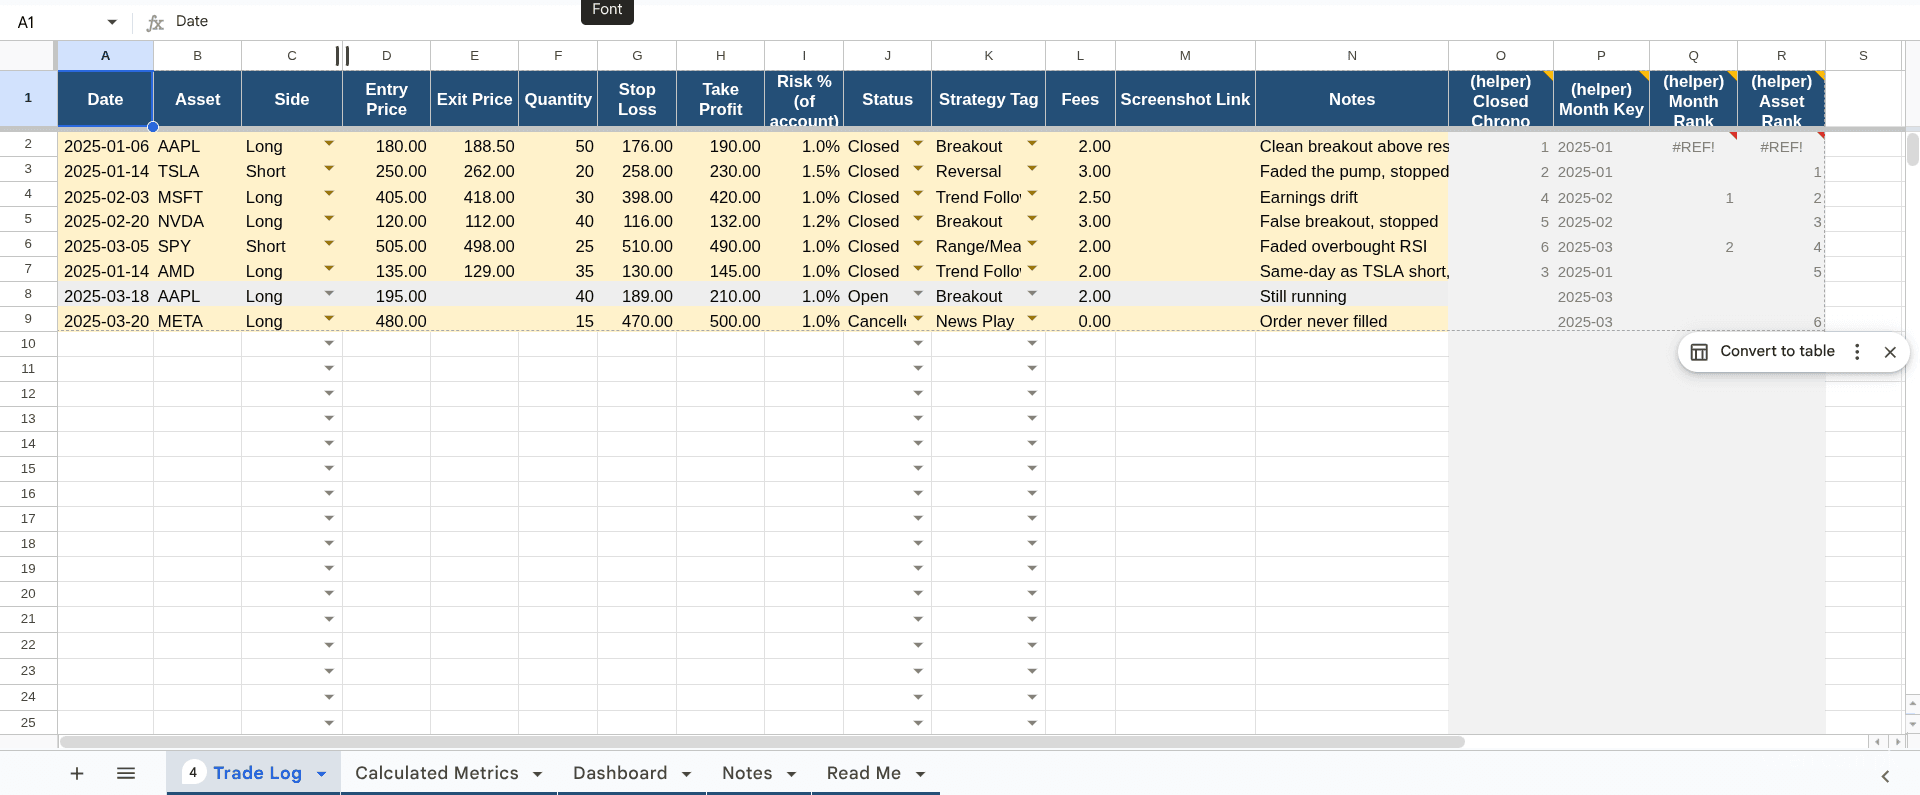
Trading journal and performance analytics Google Sheets template with automated trade log, equity curve, win-rate metrics, and risk-to-reward ratios
Preview Full High-Res Screenshots
Google Sheets Journal: Trade log register, automatic win/loss ratio calculators, and equity chart
Google Sheets Financial Model
Google Sheets • Instant Setup • Formula Protected

Trading Journal & Performance Analytics — Google Sheets Template

A comprehensive trading journal and execution telemetry template built for Google Sheets. Automatically calculates win rate, profit factor, average R-multiple, risk-to-reward ratio, and cumulative equity curves from your raw trade entries. Perfect for day traders, swing traders, and crypto desks looking for a friction-free, non-subscription tracking workbook.

Automated trade metrics: win rate, R-multiple, profit factor & expectancy
Visual cumulative equity curve and monthly performance calendar
Strategy and setup tagging for systematic edge verification
100% cloud-synced, mobile-accessible, and formula-protected layout
Google SheetsTrade LogEquity CurveR-MultipleZero SaaS
Get on Whop
Direct Whop Instant DeliveryLifetime Product UpdatesFull Source & Formula Access

Looking to browse all tools, spreadsheets, and licenses together? Explore our Whop storefront directly

Live Financial Simulators

Free Quantitative Trading & Portfolio Tools

Institutional-grade calculators and simulation models running directly in your browser. Built with real-time exchange feeds, verified historical closing series, and complete mathematical transparency.

Free Simulation ToolQuantitative Strategy

Crypto Dollar-Cost Averaging (DCA) Calculator

Backtest recurring cryptocurrency capital accumulation strategies against verified historical Binance exchange data. Models variable frequencies (daily, weekly, monthly), computes harmonic mean cost-basis averaging, and compares net ROI against Day-1 lump-sum executions.

  • Direct Binance Kline REST Endpoint Ingestion
  • Top 10 USDT Liquid Pairs (BTC, ETH, SOL, XRP)
  • Interactive Cumulative Investment & Equity Curves
Launch DCA Simulator● Live & Free
Macro Sentiment EngineInstitutional Positioning

CFTC Commitment of Traders (COT) Index

Institutional sentiment tracker reconstructing the TradingView Pine Script COT Index independently. Parses weekly CFTC legacy reports across 42 futures and FX contracts, normalizing commercial hedger versus speculative trader crowding via 3-year percentile oscillators.

  • Official Weekly CFTC Disaggregated & Legacy Data
  • 3-Year, 1-Year & 6-Month Stochastic Lookbacks
  • Overbought & Oversold Commercial Hedging Bands
Launch COT Index● Live & Free

Looking for all financial tools and custom fintech models?

Explore the full directory of open utilities or commission custom algorithmic calculators for your fund.

View All Tools (/tools)
Engagement Model

How the Process Works, From Scope to Deployment

Most projects start with a 30-minute call to nail down scope and a fixed quote — no discovery-phase invoicing. From there it's typically: architecture and data model first, a working prototype within the first 1–2 weeks so you're not waiting until the end to see anything, then iteration based on your feedback until launch. Post-launch support is scoped separately so you're never paying for maintenance you didn't ask for.

  1. 01

    Scope & Fixed Quote (30-Minute Technical Call)

    We review your data sources, broker APIs, and functional requirements. You get a clear architecture outline and a fixed quote — no discovery-phase invoicing or hourly scope creep.

  2. 02

    Architecture & Working Prototype (Week 1–2)

    Database schema and real-time feeds are wired up first. You receive a functioning prototype in the first 1–2 weeks to test live data flows early rather than waiting until final delivery.

  3. 03

    Iteration & Rigorous API Stress Testing

    Continuous milestone updates allow you to test order execution, backtest accuracy, and chart responsiveness. All edge cases like dropped sockets and rate limits are handled.

  4. 04

    Deployment & Clean Hand-Off

    Production deployment to your AWS or cloud infrastructure with complete documentation and environment configurations. Post-launch maintenance is scoped separately so you never pay for unneeded retainers.

Clear Pricing & Process

Frequently Asked Questions

Everything you need to know about pricing, delivery timelines, broker integrations, and remote collaboration.

Most custom dashboards run $3,000–$15,000 depending on data sources, real-time requirements, and how many broker/exchange integrations are involved. You get a fixed quote after a scoping call, not an hourly estimate that creeps.

Direct Engineering Access

Hire a Remote Fintech Developer — Get a Quote

Send a short brief — what you're building, what data it touches, and any deadline — and expect a reply within 1 business day with next steps or clarifying questions. No sales call required before you get a real answer.

Direct Developer Contact

You communicate directly with the engineer writing the software. Every inquiry receives a technical assessment and a fixed-scope quotation.

Location & Remote Availability

Karachi, Pakistan (UTC+5)

Overlapping business hours with US, UK/EU, and Gulf timezones.

Response Guarantee

Within 1 business day (24 hours)

Partner PerksOffers

Looking for developer tools, cloud coupons, or verified partner deals?

Explore Partner Offers
Mutual NDAs signed before scoping or codebase inspection upon request.